
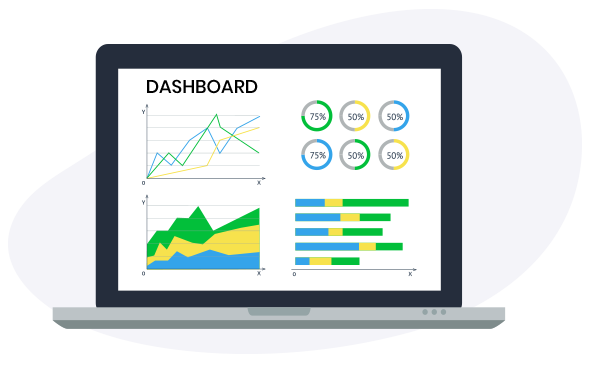

Beenius empowers operators with the latest user statistics and provides powerful user analytics. Information such as which Live TV shows, recordings or VoD movies are watched and for how long and similar other user events can be now effortlessly gathered and presented via Beenius Analytics Dashboard.
Beenius Analytics Dashboard can be tailored according to operator’s requirements, but essentially provides the information about subscriber consumption, usage, behaviour, etc. through selected events, such as: Live Most Watched, Unique Viewers, Device Types, Client Types, Catch-up Views by Channel, by program, …etc.
A flexible API is available for fetching statistics data. The operator can build its own analytics dashboard using own tools and systems.
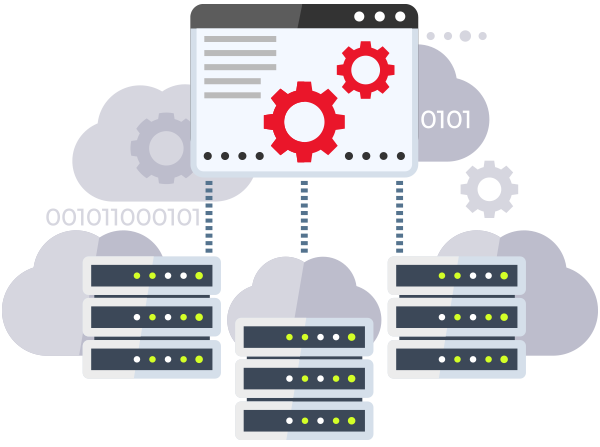
The Beenius statistics model includes two components: server and client part.
Server part is responsible for gathering data from clients, data processing, and storing it to the statistics database.
Client part is responsible for gathering events from user actions in client UI and sending them to the server.
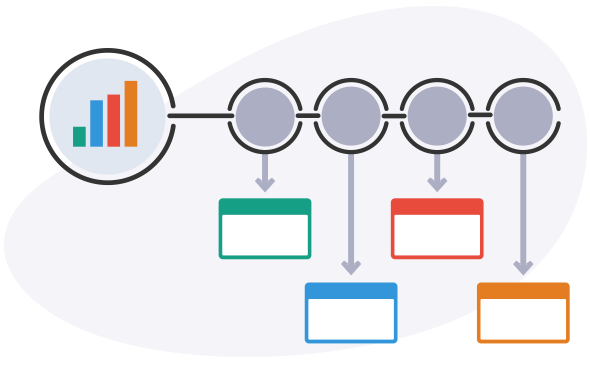
Gathered events can be based on statistics of client consumption of LiveTV Watched, VOD Watched, Program catch-up watched, Pause & Resume operation, etc.
Secondly, events can be based on client’s UI behavior of VOD bookmark created, LPVR program recording scheduled, Recommendation dashboard action, etc.
Thirdly, events can be gathered based on VoD purchase, Subscription purchase, …or Targeted Advertising Live TV, Targeted Advertising VOD, etc.
Beenius collects the statistics from several Beenius client applications, such as Beenius Linux STB, Beenius Android STB/TV, Beenius Mobile Android or iOS, as well as Beenius Web app. The statistics data are then transmitted to external DWH and analytics system.