17 Aug

This August Ofcom published Communication Market Report, which reveals how the increasing take-up of faster fixed and mobile data services is extending people’s choice over how, where and when they communicate with others, watch or listen to content services, seek information, shop and participate in the digital world.
Today consumers’ expectations for connectivity are higher and everyday present, as they co-create the »always on« society. People expect to be connected everywhere and anytime through various devices. This type of behavior sure has its advantages and consumers claim that the benefits of online outweighing the disadvantages, although increasingly, many acknowledge that ubiquitous internet access is disrupting the quality of their relationships.
Since the rise of smartphones, there has been a steady increase in the penetration of connected devices across the UK population, with smartphones owned by four of every five UK consumers and smart TVs in almost half of all households. This, coupled with growing access to superfast broadband and 4G availability, has laid the foundation for the growth of online and on-demand services. ( Falcon Media,“UK consumer communication trends benefit OTT services“, Aug 2017)
Enhanced connectivity and the proliferation of connected devices has also transformed the way society consumes media, further fragmenting audiences for TV broadcasters. Subscription services now account for 18 minutes of our daily viewing, YouTube 29 minutes, and all non-TV viewing a total of 89 minutes of our time every day. Nevertheless, despite more choice across more platforms, broadcasters continue to account for the majority of our viewing. This increased fragmentation has affected viewing patterns in various ways, depending on the TV genre. (InformItv, “Television viewing faces online challenge“, Aug 2018).

Always on Society
The convenience of using the internet on a smartphone, and the availability of 4G, were key drivers for 62% of all adult online minutes were spent on the smartphone in 2018.
Average monthly household spend on mobile voice and data services has reduced by 8% (£4.02) since 2012, to £45.99 per month in 2017. In contrast, average monthly spend on fixed voice and internet services increased by 14.3% over the same period to £41.13. This is mostly because consumers have migrated to superfast broadband services, which tend to be more expensive than standard broadband services.
Between 2016 and 2017, the household spends on television decreased by an average of £1.19 (4%) per month, reaching a five-year low of £32.64. However, this excludes spend on online streaming services such as Netflix and Amazon Prime Video, whose revenues increased significantly to £895m in the UK in 2017 and are now in around 40% of households.
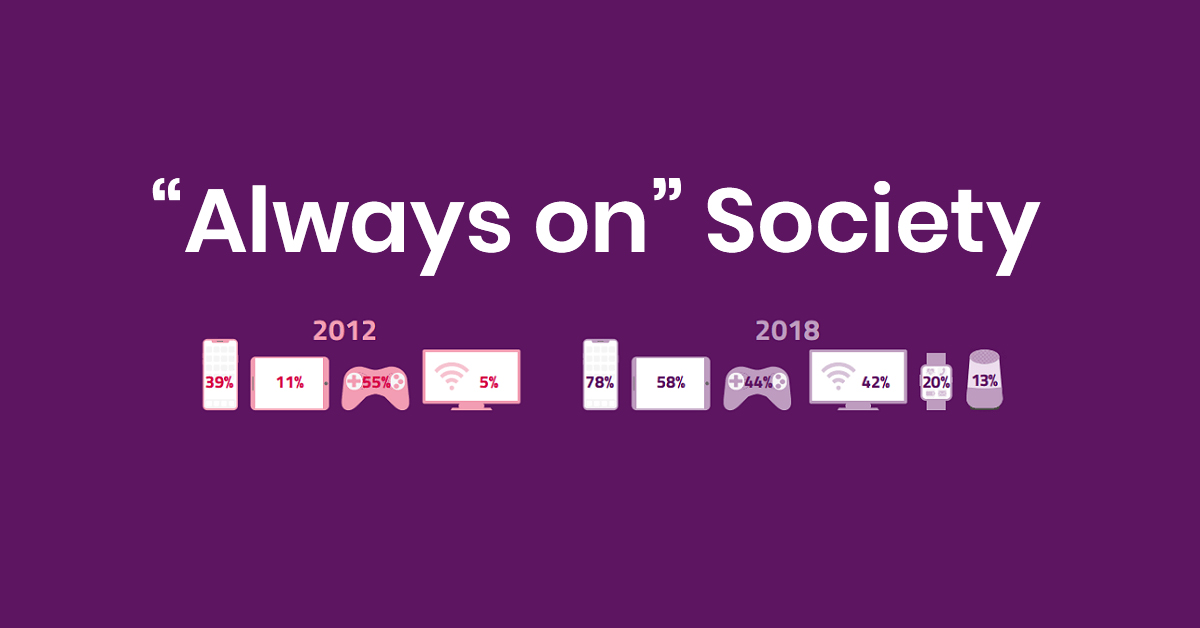
While take-up of fixed broadband has plateaued at 80%, accessing the internet on a mobile phone continues to grow, from 66% in 2017 to 72% in 2018. Almost eight in ten UK adults (78%) personally use a smartphone.
Smart TV penetration continues to surge but remains behind game consoles and DVD players. Take-up of smart TVs, i.e., televisions which can connect directly to the internet, has increased from 5% in 2012 to 42% of households in 2018.
Purchasing communications services in a bundle
Just under eight in ten households (79%) reported buying at least two of their communications services as a bundle from the same supplier in H1 2018, in line with the last two years (81% and 79%). Dual-play packages of landline and broadband, and triple-play packages of landline, broadband, and TV were the most popular, both at 31% of households.
Always on: The connected consumer
Research by TouchPoints in 2017 found that 64% of adults in Great Britain agreed that the internet was an essential part of their life, up from 54% in 2012. Among under-35s, more than 80% agreed, but the steepest increase was among over-65s, with 36% considering the internet to be essential, up from 22% five years previously. ( Alex Watson, “This is how much time the average person spends online every week“, Aug 2018)
The findings of Ofcom’s research shows that the 88% of adults who ever use the internet spend an average of 24 hours each week online, almost double the time spent in 2007 (12 hours 6 minutes). Overall, a third (33%) of adults said they spend up to ten hours online each week, and 54% said up to 20 hours. Almost a fifth of adults (19%) said they spend more than 40 hours each week online, up from just 5% of adults in 2007.
Smart devices keep people constantly connected, both in and out of the home

The devices we use to go online have also developed over the past ten years, both in terms of enhancements such as features and processing power, and in the range of devices available.
Smartphones first came onto the mainstream market in 2007 (the Apple iPhone) and 2008 (the first Android19 handset) and now 78% of UK adults personally use one.
Tablet computers (e.g. the iPad) followed, and 58% of households now have at least one. Ofcom started measuring the take-up of smart TVs20 in 2012 when just 5% of households had one. This has risen to 42% of households in H1 2018.
Although this research is based on UK studies, it can be easily transferred to other European countries. The trends of “always on” society are present all around us and are becoming a part of everyday standards which operators should take into consideration when looking to become Viewers” First Choice.
Contact Beenius representative for complete end-2-end consultancy services for IPTV, OTT or Hybrid BVD-x solutions.
