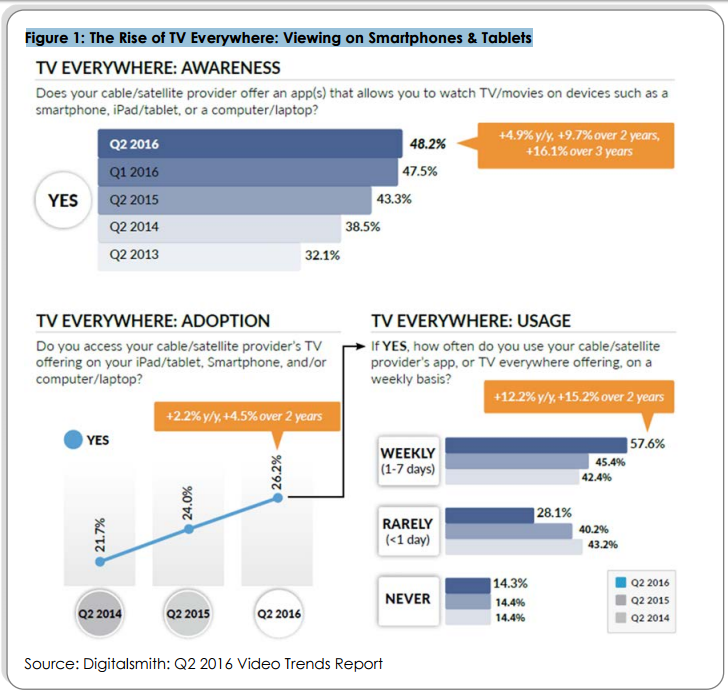
The 500 channel universe of yesterday could shortly become the 1 million-channel universe of tomorrow, due to the increase of content providers. The content from online video providers like Netflix, Hulu, YouTube and Amazon has been embraced by consumers rapidly. With the rise of tablets, smartphones, video-games consoles and other mobile video devices in the home, consumers are spreading their viewing habits from 1 to 4 screens.
The report below shows that consumers are making more frequent use of TV Everywhere service and this trend is not planning to stop any time soon.
White Paper. Alan Beznick, Openet
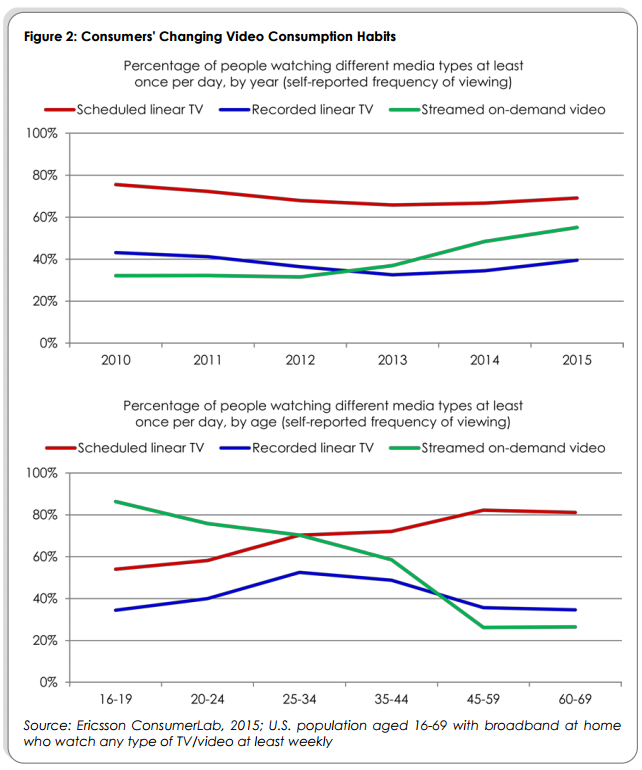
Younger viewers (below the age of 34) are attracted to OTT video and are either cutting their existing pay-TV services or they never sign up for conventional Pay-TV offerings to begin with. Studies shown that in the U.S. more than 70% of millennials using streaming service in 2015 and the trend is rising.
Due to the free or inexpensive WiFi now widely available both inside and outside the home, mobile is on the upswing. Alongside Social Media are threatening to play even more direct role in the video business.
White Paper. Alan Beznick, Openet
These are just several facts that operators need to have in mind when they are marketing their bundles and their pay TV proposals.
Operators’ challenges
Having a 360° view and complete understanding of who are the people watching TV, when and how the content is consumed is not an easy task.
Big Data can be helpful for operators because:
Data can be used to update subscribers profiles;
Enriched information can be used for detailed segmentation for delivery of personalized offers and advertising;
The audience measurement data can be used during the negotiations for carriage fees with content providers;
With video data usage analytics, pay TV providers are able to tell who is watching what, and are able to personalize their video offerings for viewers and monetize those offerings with targeted, addressable advertising.
The number of Internet- connected TV devices in the home now matches or exceeds the number of conventional pay-TV STB in the home. In a study released by Leichtman Research Group in April 2016, 2/3 of all U.S. TV homes (65%) now have at least 1 TV connected to the Web in some way, up from 44% in 2013 and just 24 % in 2010.
Beenius helps operators with User Statistics feature. Statistics as an analytical feature helps analysing how subscribers consume TV services. The user statistics module provides insight into detailed levels of usage and viewership. User Statistics by Beenius covers linear TV, time-shifted programming, VOD viewing and digital video services, Catch-up TV and NPVR recordings.
Problems traditional pay-TV providers are facing:
Not collecting the available viewing data as effectively as they could.
They should improve their analytical capabilities measurably in the past year.
The changes in how people are viewing TV and other video programming are affecting how service providers need to collect, manage and monetize viewing data. Instead of just collecting viewing data from TV sets and STBs, systems must now gather data in real time from numerous sources, ranging from STBs to tablets to gaming consoles to mobile phones.
Operators can leverage the data to:
Update subscriber profiles;
Use enriched data to offer richer customer segmentation for the delivery of personalized offers and advertising;
Inform their programming, ad inventory and placement decisions and negotiate more favourable carriage fees with content providers.
The challenges that TV operators are facing today are thrilling but with the right platform and with the team of people who understand the importance of Big Data, users’ statistics and personalization, the success of the operator is inevitable.
By clicking “Accept All Cookies”, you agree to the storing of cookies on your device to enhance website navigation, analyze website usage, and assist in our marketing efforts.
Accept All
Cookies Preference
Cookies Preference
Cookies Preference
Privacy settings
When you visit any website, it may store or retrieve information on your browser, mostly in the form of cookies. This information might be about you, your preferences or your device and is mostly used to make the website work as you expect it to. The information does not usually directly identify you, but it can give you a more personalized web experience. Because we respect your right to privacy, you can choose not to allow some types of cookies. Click on the different category headings to find out more and change our default settings. However, blocking some types of cookies may impact your experience of the website and the services we are able to offer.
Remember which cookies group you accepted
Remember your login details
Essential: Remember your cookie permission setting
Essential: Allow session cookies
Essential: Gather information you input into a contact forms newsletter and other forms across all pages
Essential: Keep track of what you input in a shopping cart
Essential: Authenticate that you are logged into your user account
Essential: Remember language version you selected
Functionality: Remember social media settings
Functionality: Remember selected region and country
Analytics: Keep track of your visited pages and interaction taken
Analytics: Keep track about your location and region based on your IP number
Analytics: Keep track of the time spent on each page
Analytics: Increase the data quality of the statistics functions
Advertising: Tailor information and advertising to your interests based on e.g. the content you have visited before. (Currently we do not use targeting or targeting cookies.
Advertising: Gather personally identifiable information such as name and location
These cookies are necessary for the website to function and cannot be switched off in our systems. They are usually only set in response to actions made by you which amount to a request for services, such as setting your privacy preferences, logging in or filling in forms. You can set your browser to block or alert you about these cookies, but some parts of the website will not then work. These cookies do not store any personally identifiable information.
Essential: Remember your cookie permission setting
Essential: Allow session cookies
Essential: Gather information you input into a contact forms, newsletter and other forms across all pages
Essential: Keep track of what you input in a shopping cart
Essential: Authenticate that you are logged into your user account
Essential: Remember language version you selected
Functionality: Remember social media settings
Functionality: Remember selected region and country
Remember your login details
Analytics: Keep track of your visited pages and interaction taken
Analytics: Keep track about your location and region based on your IP number
Analytics: Keep track of the time spent on each page
Analytics: Increase the data quality of the statistics functions
Advertising: Tailor information and advertising to your interests based on e.g. the content you have visited before. (Currently we do not use targeting or targeting cookies.
Advertising: Gather personally identifiable information such as name and location
These cookies allow us to count visits and traffic sources so we can measure and improve the performance of our website. They help us to know which pages are the most and least popular and see how visitors move around the website. All information these cookies collect is aggregated and therefore anonymous. If you do not allow these cookies we will not know when you have visited our website, and will not be able to monitor its performance.
Essential: Remember your cookie permission setting
Essential: Allow session cookies
Essential: Gather information you input into a contact forms, newsletter and other forms across all pages
Essential: Keep track of what you input in a shopping cart
Essential: Authenticate that you are logged into your user account
Essential: Remember language version you selected
Functionality: Remember social media settingsl Functionality: Remember selected region and country
Analytics: Keep track of your visited pages and interaction taken
Analytics: Keep track about your location and region based on your IP number
Analytics: Keep track of the time spent on each page
Analytics: Increase the data quality of the statistics functions
Advertising: Use information for tailored advertising with third parties
Advertising: Allow you to connect to social sitesl Advertising: Identify device you are using
Advertising: Gather personally identifiable information such as name and location